

Background
A user reported a scenario in which the throughput between two systems was very slow. Throughput is a very important metric in system performance analysis , and there are many related influencing factors. Therefore, it is a relatively complex analysis process when reflected in network packet analysis.
Case study from SharkFest 2010 “Packet Trace Whispering”
Problem Information
The basic information of the trace file is as follows:
λ capinfos EvilOddFinal.pcap
File name:           EvilOddFinal.pcap
File type:           Wireshark/tcpdump/... - pcap
File encapsulation:  Ethernet
File timestamp precision:  microseconds (6)
Packet size limit:   file hdr: 8192 bytes
Packet size limit:   inferred: 64 bytes
Number of packets:   1004
File size:           80 kB
Data size:           1109 kB
Capture duration:    6.013219 seconds
First packet time:   2010-01-13 04:55:32.247712
Last packet time:    2010-01-13 04:55:38.260931
Data byte rate:      184 kBps
Data bit rate:       1475 kbps
Average packet size: 1104.69 bytes
Average packet rate: 166 packets/s
SHA256:              19cc103f13f74f8c3359f99c5ff883cce880361c823ff736c4b6d89d26e68b9e
RIPEMD160:           d879ea22aaff08a5b7a44ecd68b86cb71053bf46
SHA1:                afc170ee286153a9d9ce8dd19a9a4fe27d3df46b
Strict time order:   True
Number of interfaces in file: 1
Interface #0 info:
                     Encapsulation = Ethernet (1 - ether)
                     Capture length = 8192
                     Time precision = microseconds (6)
                     Time ticks per second = 1000000
                     Number of stat entries = 0
                     Number of packets = 1004

λ
The trace file was captured by tcpdump on Linux. The number of packets was 1004, the length was truncated to 64 bytes, the file data size was 1109K bytes, the capture time was about 6 seconds, and the average rate was 1475 kbps.
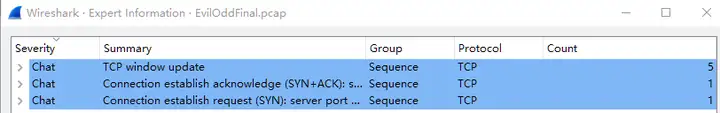
The expert information is as follows. It is extremely concise. You can see that there is no Warning message, such as retransmission, disorder, etc. After simply eliminating some common problems, the real cause requires further actual analysis.
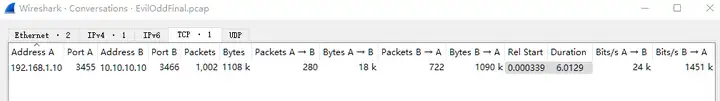
In addition, the statistics – session information is as follows. There is only one TCP flow. The main direction of data transmission is 10.10.10.10 -> 192.168.1.10. The rate is low, only 1451 kbps, which is indeed consistent with the phenomenon of slow throughput.
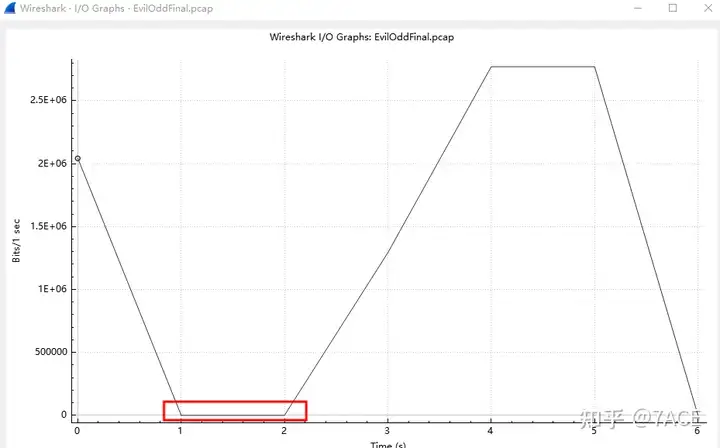
The same statistics – I/O Graphs are as follows. There is a relatively obvious period of time before and after without any data transmission, and the overall rate is low.
Problem Analysis
Expand the main view of the packet trace file, the first is the TCP three-way handshake information.

A brief analysis is as follows:
- IRTT 0.000339 seconds, determined to be within a local area network;
- Considering the time difference between SYN, SYN/ACK, and ACK, it is determined that the packet capture point is on the server or close to the server;
- The client is Win 64512, which does not support WS (Window Scale Factor); the server is Win 32768, which also does not support WS;
- The MSS of both client and server is 1460, the standard value;
- The client and server do not support SACK, etc.;
- The client and server do not support timestamps.
Since this TCP Stream does not support WS and SACK, the inefficiency here may be a problem.
Considering the low overall transmission rate and the I/O Graph results, you can add frame.time_delta_displayedinformation columns to check the time interval between data frames and sort them from largest to smallest.
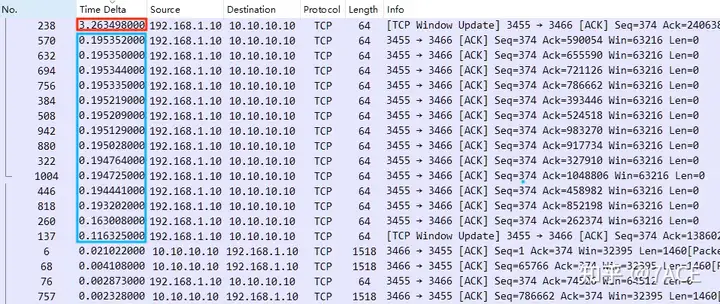
It can be seen that there are some obvious large delays, including the largest 3.26s, multiple 195ms, etc. , analyzed in turn:
- 3.26s
Data frame No. 238 comes from the client. Wireshark also clearly indicates that this is a TCP Window Updatedata packet, which is the client’s Window update.
Before and after locating No.238, we can see that the data transmission direction is server 10.10.10.10 -> client 192.168.1.10. The server sends multiple MSS segments, and the client confirms them in turn with ACK. However, the Window of No.237 continues to decrease to 436 (probably due to the client’s application processing capacity, which makes the window not released in time). Since the receiving window is less than 1 MSS, the server cannot continue to send data until the Window sent by client No.238 is updated, and then the server continues to send data.
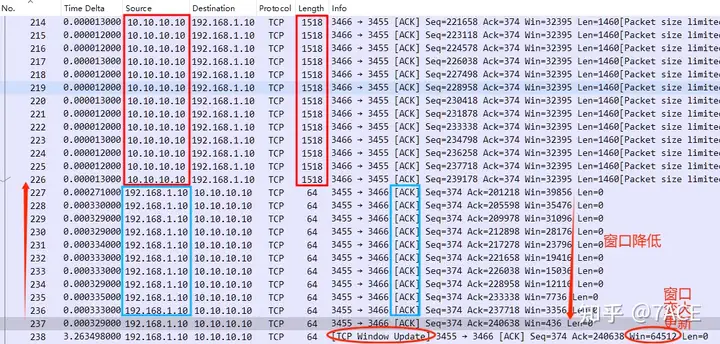
Therefore, the 3.26s delay here is caused by the TCP Window being too small. It is recommended to enable support for TCP WS or check the client performance to solve the low efficiency problem.
2. 195ms
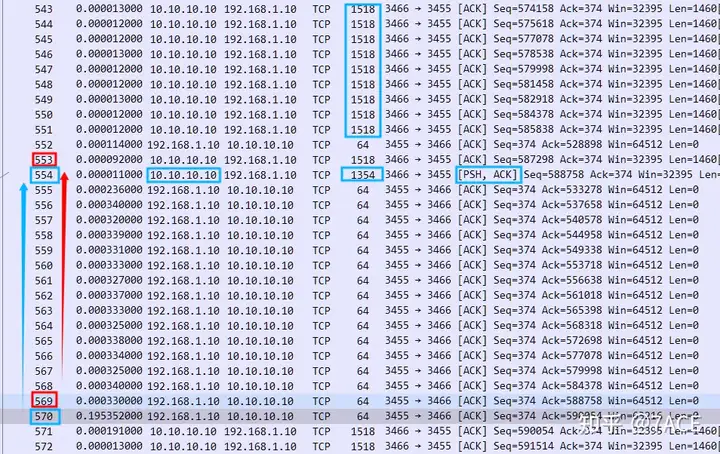
195ms is also a delay from the client. By expanding one of the No.570 data frames, we can see that the data transmission direction is server 10.10.10.10 -> client 192.168.1.10. The server sends multiple MSS segments, and the client confirms them in turn with ACK.
The client No.569 ACK confirms No.553, but after receiving the last segment No.554 (with the PSH flag) sent by the server application, due to the delayed ACK mechanism, the client is waiting for the second data packet from the server to arrive, but it happens to be the last segment sent by the application, an odd number problem ~ so the confirmation is delayed by about 200ms before the client sends No.570 ACK.
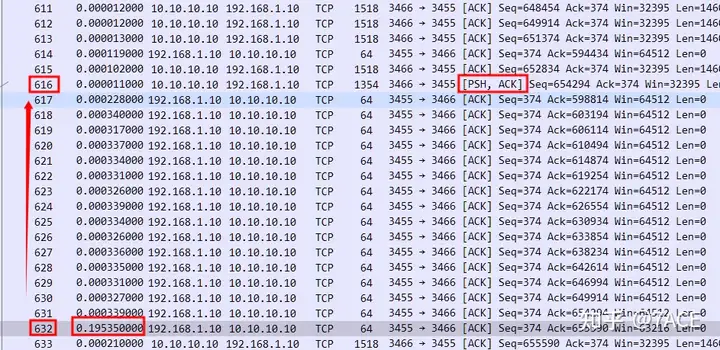
Although it seems that the delay is only 200ms, as data transmission proceeds, there will be many odd-numbered packets with delayed acknowledgments (the same as No. 632 below), so the total idle waiting time is also a relatively long period. In fact, there is nothing wrong with delayed acknowledgment itself, but depending on the actual application scenario, it can also be canceled by setting options such as TCP_QUICKACK.
Delayed ACK Reference
TCP Delayed ACK (delayed confirmation) strives to improve network performance by combining several ACK response groups into a single response, or sending the ACK response together with the response data to the other party, thereby reducing protocol overhead. Specific practices:
- When there is response data to be sent, ACK will be sent to the other party immediately along with the response data;
- If there is no response data, the ACK will be sent delayed to wait and see if there is response data to send together;
- If the other party’s second data packet arrives while waiting to send ACK, then ACK should be sent immediately. However, if the other party’s three data packets arrive one after another, whether to send ACK immediately when the third data segment arrives depends on the above two conditions.
Summary of the problem
So in general, slow system throughput is not necessarily caused by network congestion and packet loss. TCP window and some mechanisms at the protocol level may also be the reasons.