

Topic Information
This case is the second topic in Sharkfest 2015 Packet Challenge, GO GO SPEED RACER , and the packet trace file is http-gogo.pcapng .
The main description is as follows:
- What is the HTTP response time for the GET / request in packet 4?
- How many packets have the SYN bit set on in this trace file?
- What is the name of the largest HTTP object downloaded to this client?
- How long did it take to download the browser tab icon, favicon.ico (include TCP connection setup/teardown)?
- Frame 131 is a spurious retransmission. Which previous frame caused this to be marked “spurious”?
Packet information
The basic information of the packet trace file is as follows:
λ capinfos http-gogo.pcapng
File name: http-gogo.pcapng
File type: Wireshark/... - pcapng
File encapsulation: Ethernet
File timestamp precision: microseconds (6)
Packet size limit: file hdr: (not set)
Number of packets: 904
File size: 670 kB
Data size: 639 kB
Capture duration: 25.295004 seconds
First packet time: 2013-05-17 04:34:45.147106
Last packet time: 2013-05-17 04:35:10.442110
Data byte rate: 25 kBps
Data bit rate: 202 kbps
Average packet size: 707.62 bytes
Average packet rate: 35 packets/s
SHA256: d7206ad61a744fe27a62fc4ee1798f5a925e946dbd18fcf23e53790da23e384d
RIPEMD160: 4a3c95a711886b96fcbdac63c5abbc917ced054e
SHA1: 5888fedc0be380ec14be6e2b79eb1bda889edc35
Strict time order: True
Capture oper-sys: 64-bit Windows 7 Service Pack 1, build 7601
Capture application: Dumpcap 1.10.0pre1-49307 (SVN Rev 49307 from /trunk-1.10)
Number of interfaces in file: 1
Interface #0 info:
Name = \Device\NPF_{6E79FEC0-FF79-4970-96E4-EEFF300A9B9F}
Encapsulation = Ethernet (1 - ether)
Capture length = 65535
Time precision = microseconds (6)
Time ticks per second = 1000000
Time resolution = 0x06
Operating system = 64-bit Windows 7 Service Pack 1, build 7601
Number of stat entries = 1
Number of packets = 904
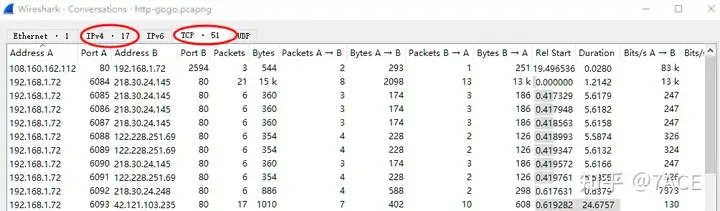
λThe data was captured directly through Wireshark on the Windows 7 system without truncation. The number of captured packets was 904, the capture duration was 25.3 seconds, and the average rate was 202 kbps. There was more IPv4 and TCP session information.
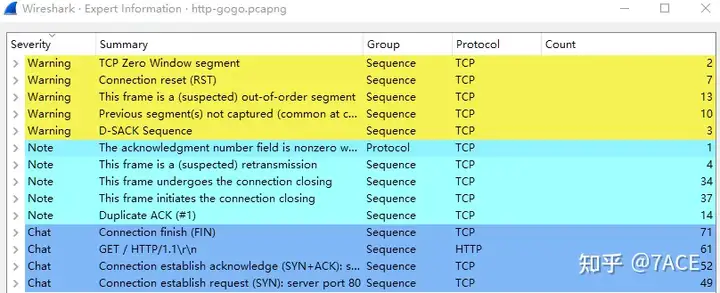
The expert information is shown as follows. Among them, there are problems such as TCP zero window, disorder, and segmentation not captured in the alarm level. The relative number is not that large, and it is necessary to actually enter the data packet analysis .
Packet Analysis
tcp.portBecause the title and question are related to HTTP, we simply filter and identify the data packet information. The number of data packets related to HTTP or HTTPS is 904, which is the same as the total number of data packets in this data packet tracking file. The number of TCP flows is 51 after sorting and deduplication .
λ tshark -r http-gogo.pcapng -Y "tcp.port in {80,443}" | wc -l
904

λ tshark -r http-gogo.pcapng -Y "tcp.port in {80,443}" -T fields -e tcp.stream | sort -n | uniq | wc -l
51
Considering that there is a lot of data packet information involved, we will directly enter the actual analysis of each question.
1. What is the HTTP response time for the GET / request in packet 4?
What is the HTTP response time for the GET / request in packet 4?
Analysis steps
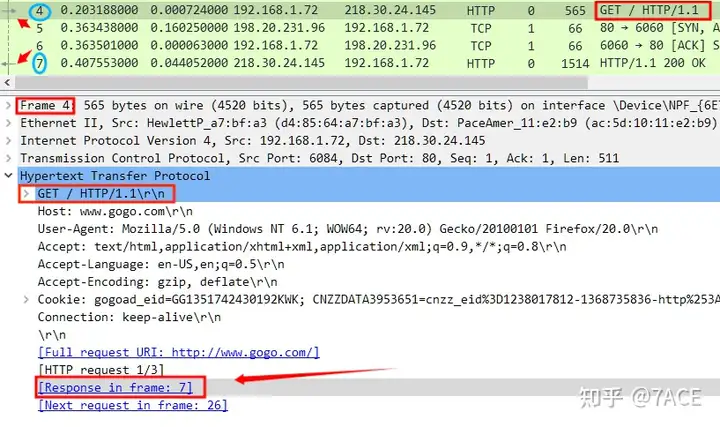
Data packet No.4 is an HTTP GET / request. In Packet Detailsthe view, you can see the Wireshark prompt [Response in frame:7], indicating that the HTTP Response data packet is in No.7. At the same time, [Packet List]there are two small horizontal arrows on the leftmost vertical side of the view, one pointing to No.4 and the other pointing to No.7, which also indicates that it is a pair of HTTP request and response data packets .
Because we want to analyze the value of HTTP response time, we turn to the details of packet No. 7 and see [Time since request: 0.204365000 seconds]that this is the time interval Wireshark obtains based on the HTTP Request packet time associated with the context.
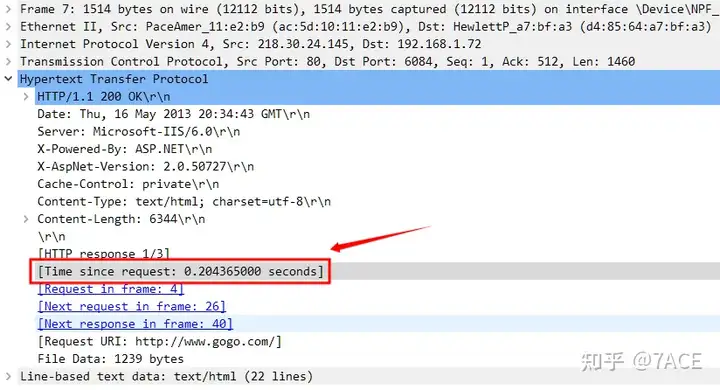
Analyze the answer
The HTTP response time for the GET / request in packet 4 is: 0.204365000 seconds.
2. How many packets have the SYN bit set on in this trace file?
How many packets in the packet trace file contain the SYN flag set.
Analysis steps
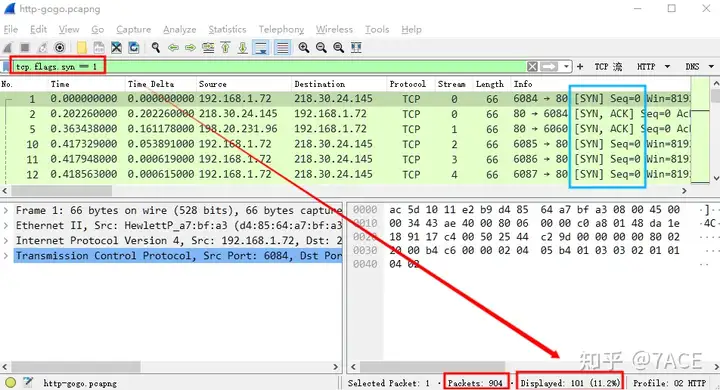
This question is relatively simple and can be solved by filtering through TCP Flags. However, I would like to point out that in Wireshark display filtering, there is a clear difference between tcp.flags.synand tcp.flags.syn == 1. The former refers to whether the field exists or not (including 0 and 1), while the latter is when SYN is set to 1 (that is, filtering out SYN and SYN/ACK in the TCP three-way handshake).
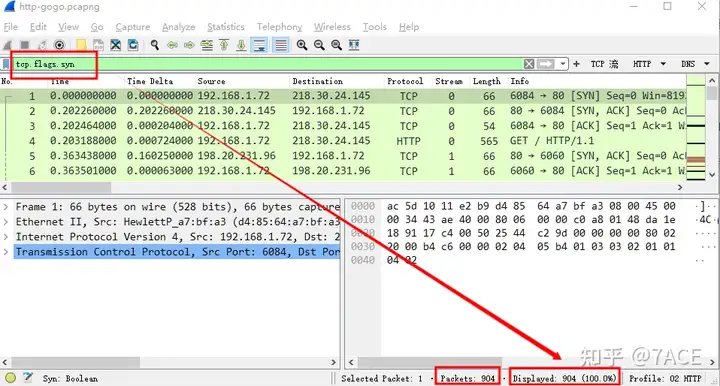
Through tcp.flags.syn == 1filtering, we found that there are 101 SYN and SYN/ACK packets in total, accounting for 11.2%.
Use Tshark to filter as follows
λ tshark -r http-gogo.pcapng -Y "tcp.flags.syn==1" | wc -l
101

λ
Analyze the answer
How many packets in the packet trace file contain the SYN flag set: 101.
3. What is the name of the largest HTTP object downloaded to this client?
What is the name of the largest HTTP object downloaded to this client ?
Analysis steps
HTTP object can be directly obtained through Wireshark File-> Export Objects-> HTTP...the following information.
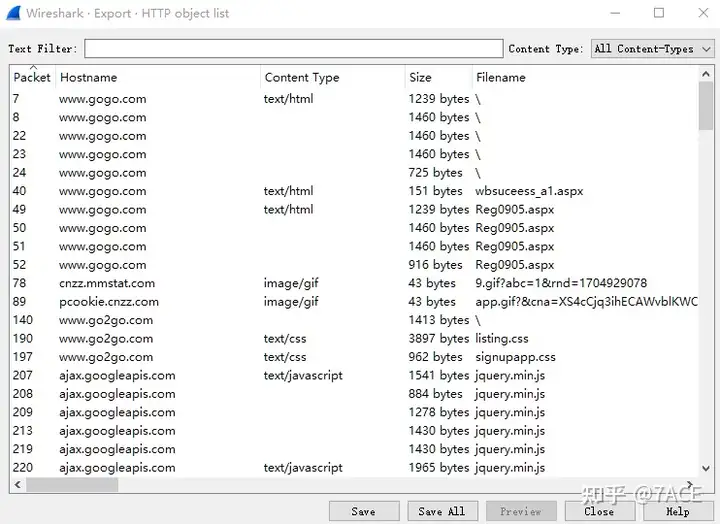
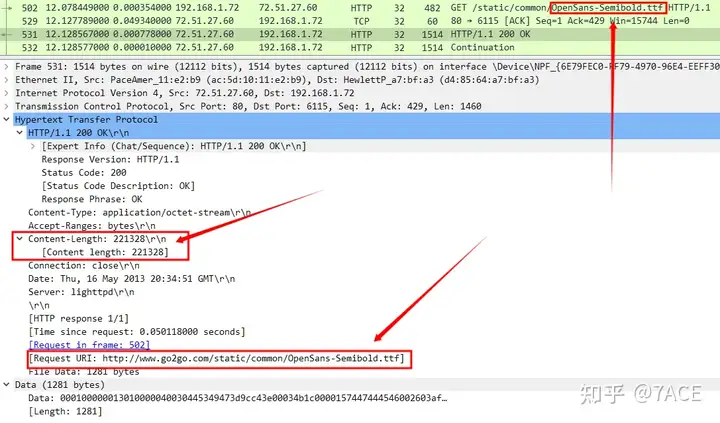
Then Sizeyou can sort them from largest to smallest. Because the same file may exist in multiple data packages, pull down to traverse the data package file names and sizes. You can see that the actual largest file is OpenSans-Semibold.ttf .
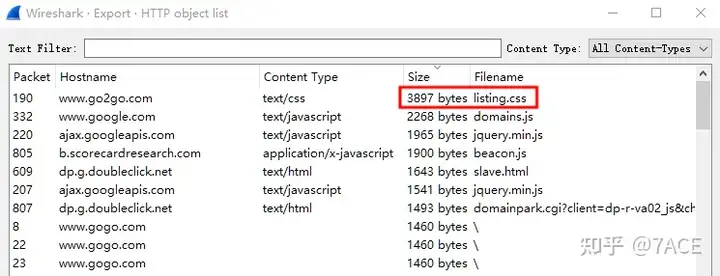
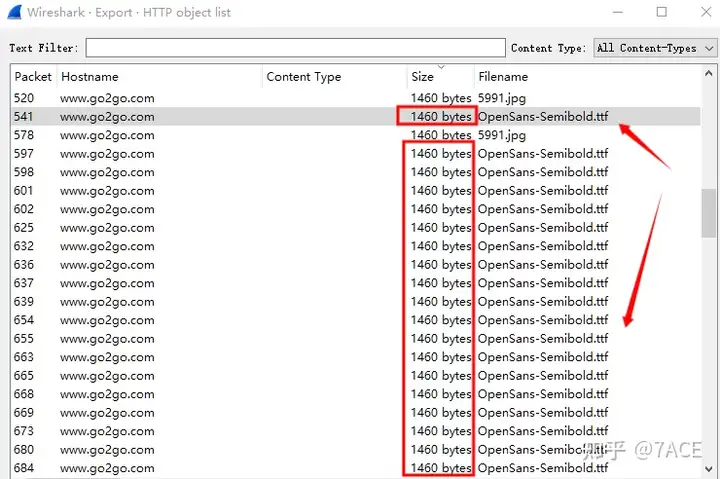
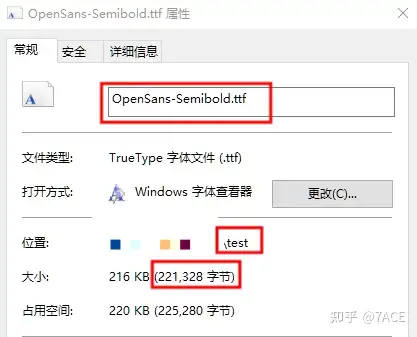
The file OpenSans-Semibold.ttf has a size of 221328 bytes .
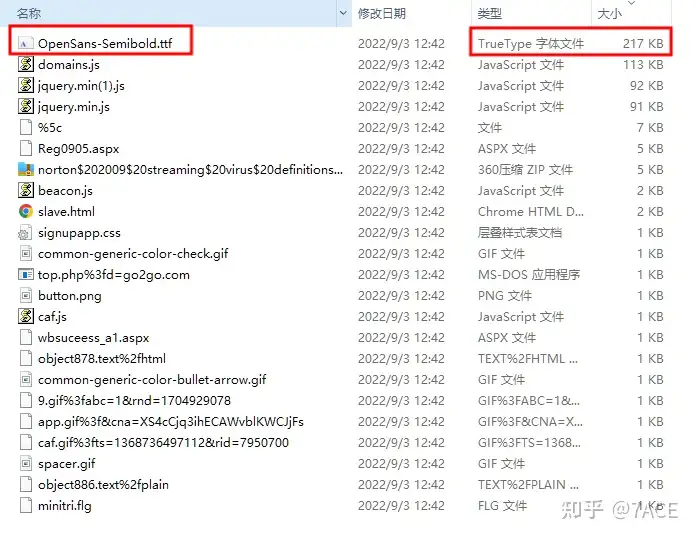
Personally, it may be easier to use Tshark to analyze this problem, and --export-objectsexport the HTTP Object to the test folder through the parameter.
tshark -r http-gogo.pcapng -q --export-objects http,testAll HTTP Objects in the test folder are as follows
Analyze the answer
The name of the largest HTTP object downloaded to this client is: OpenSans-Semibold.ttf .
4. How long did it take to download the browser tab icon, favicon.ico (include TCP connection setup/teardown)?
How long does it take to download the browser tab icon favicon.ico (including TCP connection setup/teardown)?
Analysis steps
Because you need to find favicon.icothe TCP connection that contains the download, you can first find the connection by filtering the http uri
http.request.uri contains "favicon.ico"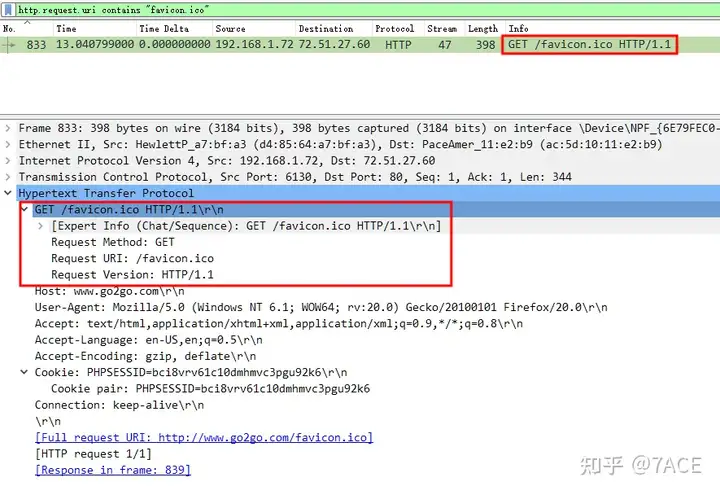
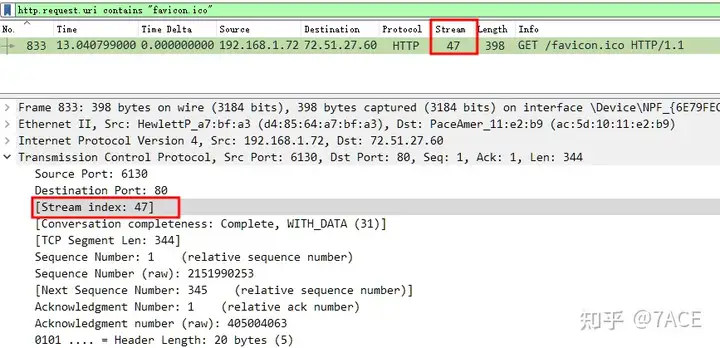
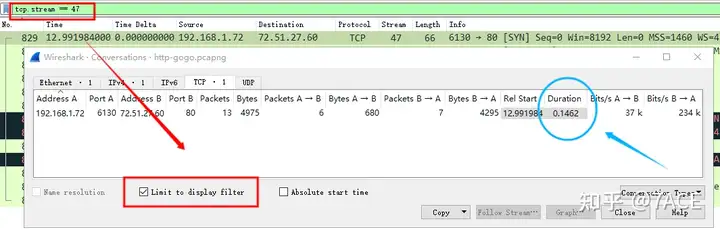
TCP Stream is 47
After expanding the flow, 13 related data packets are obtained.
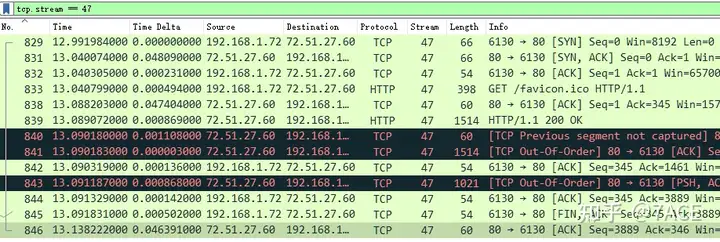
To get the time of this flow, you can directly click on No.846 detailed information [Timestamps]to get the time difference between the last data packet and the first data packet.
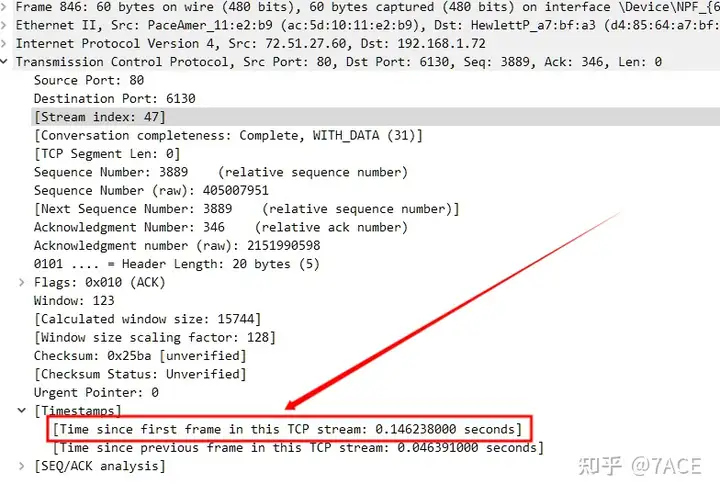
You can also see the statistical time of the flow in the session view, which is 0.1462 seconds.
Analyze the answer
Downloading browser tab icon favicon.ico (including TCP connection setup/teardown) takes: 0.146238000 seconds.
5. Frame 131 is a spurious retransmission . Which previous frame caused this to be marked “spurious”?
Data frame 131 is a false retransmission. Which previous frame caused this frame to be marked as “false”?
Analysis steps
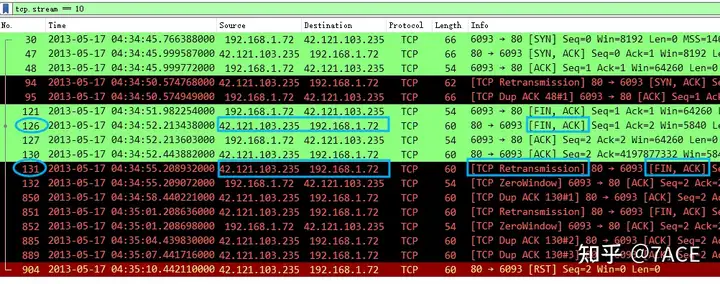
False retransmission, in simple terms, means that a packet with a certain Seq Num has been ACKed in the packet trace file, but then another packet with the same Seq Num is received.
According to the analysis of the TCP flow where the No.131 data frame is located , it can be seen that No.121, No.126 and No.127 have completed a TCP four-way handshake, but the server sent No.130 ACK again due to some problem, as well as the retransmitted FIN/ACK of No.131. It is suspected that the server did not receive No.127 and generated a timeout retransmission.
Refer to the definition of Wireshark in the official website documentation TCP Spurious Retransmission:
TCP Spurious RetransmissionChecks for a retransmission based on analysis data in the reverse
direction . Set when all of the following are true: – The SYN or FIN flag is set. – This is not a keepalive packet. – The segment length is greater than zero . – Data for this flow has been acknowledged. That is, the last-seen acknowledgment number has been set. – The next sequence number is less than or equal to the last-seen acknowledgment number.Supersedes “Fast Retransmission”, “Out- Of-Order”, and “Retransmission”.
Analyze the answer
Data frame 131 is a false retransmission. Which previous frame caused this frame to be marked as “false”: No.127.