

Background
One day, a colleague from the R&D center reported a serious TCP Data Transmission Delay when transmitting data from server A to server B across data centers. The data could not be transmitted, with peak data volume potentially nearing 100Mbps, resulting in a significant backlog.
Considering a recent system upgrade last weekend, I also sought to determine if there were any adjustments or changes to the network and related transmission traffic across data centers. It’s essential to check for any modifications when troubleshooting TCP Data Transmission Delay issues.
The three tricks are correct. It seems that when troubleshooting at any level, the first thing to do is to check whether there are any changes.
Problem Analysis
The network first traced back the change information before and after the failure point to confirm that there were no relevant changes. At the same time, the channel traffic across data centers was checked and there was no congestion, which was far from reaching the line bandwidth alarm threshold.
Considering that the business transmission only has a data bandwidth of 100Mbps, although I think this amount is not a problem within the data center and between data centers, I cannot be too sure, especially since it is a production failure, so it is better to be realistic.
We further inquired about the end-to-end business server IP and the time of the failure, which happened to occur during the peak business period. During this period, we carefully checked the end-to-end network equipment information and preliminarily confirmed that the problem was not caused by network equipment and line bandwidth.
So was it an application or system performance issue? Considering that this problem occurred for two consecutive days, colleagues in the R&D center made preparations in advance and captured relevant data packets at the time of the failure on the second day to find out the truth.
The basic information of the trace file is as follows:
$ capinfos 2-2.cap
File name:           2-2.cap
File type:           Wireshark/tcpdump/... - pcap
File encapsulation:  Ethernet
File timestamp precision:  microseconds (6)
Packet size limit:   file hdr: 65535 bytes
Number of packets:   5534
File size:           110 MB
Data size:           110 MB
Capture duration:    196.211461 seconds
First packet time:   2022-03-10 09:34:56.351199
Last packet time:    2022-03-10 09:38:12.562660
Data byte rate:      560 kBps
Data bit rate:       4487 kbps
Average packet size: 19887.27 bytes
Average packet rate: 28 packets/s
SHA256:              e1174e2d576c4ae86fecafe3b983482915ba361b8bec3b002b4856cada67c4bd
RIPEMD160:           e810177b320e64b63579732ad022d4b98a38386a
SHA1:                fe09b8e08dc24661008e9fee983d932f250f785b
Strict time order:   True
Number of interfaces in file: 1
Interface #0 info:
Encapsulation = Ethernet (1 - ether)
Capture length = 65535
Time precision = microseconds (6)
Time ticks per second = 1000000
Number of stat entries = 0
Number of packets = 5534
The trace file captured about 196 seconds, and the average rate was only 4.4 Mbps, which was extremely low and did not match the 100 Mbps previously reported by the business. This might be due to different statistical calibers.
First, check the session in the statistics. The required data packets are filtered in the trace file, and only one TCP Stream 0 is included, which is convenient for troubleshooting analysis. The main data transmission direction is Server -> Client, accounting for 109M of the 110M.

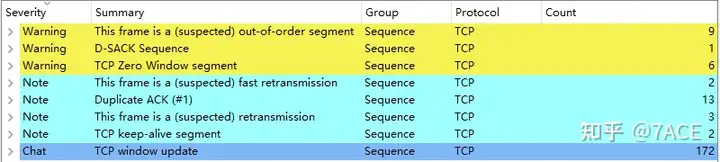
Expert information shows some problems such as zero window, out of order, retransmission and fast retransmission.
Further analysis
First, check the I/O Graphs in the statistics, as follows
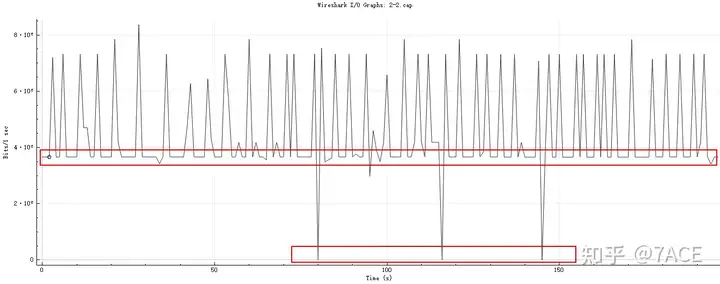
The data transmission rate fluctuates greatly and has a clear bottom, sometimes almost reaching 0. In terms of intervals of seconds, there are times when the transmission is completely stopped.
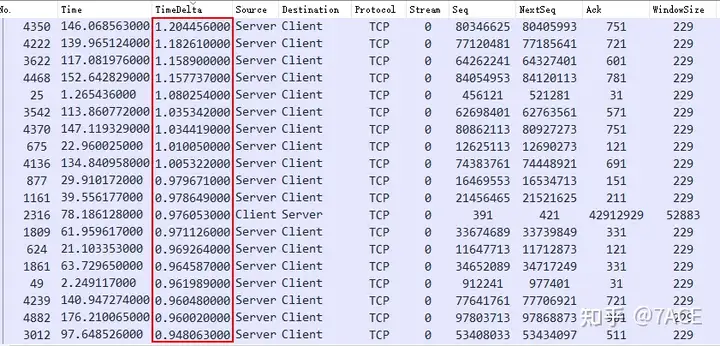
By sorting the data packets frame.time_delta_displayedfrom large to small, we can see that there are obvious large delays, most of which are in the direction of Server -> Client data transmission, with the maximum delay being more than 1s. A rough estimate shows that there are 306 data packets with a delay of more than 20ms, accounting for 5.5% of the total; 265 data packets with a delay of more than 100ms, accounting for 4.8% of the total; and 228 data packets with a delay of more than 500ms, accounting for 4.1% of the total. If these delay data are added together, it is simply too much, no wonder the data transmission rate is only 4.4 Mbps.
What is the specific cause?
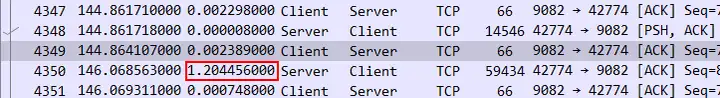
First, we analyze the top three packets No. 4350, No. 4222, and No. 3622 in the Server -> Client direction. A careful observation shows that the data transmission pattern is basically the same: after the server transmits data with a PSH/ACK and the client ACK confirms it, the server will pause for a while before starting the next transmission. Because this trace file was captured on the server (based on Len greater than 1514 and TTL 64), this pause time is more likely to be caused by the server application itself.
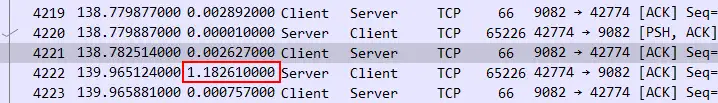
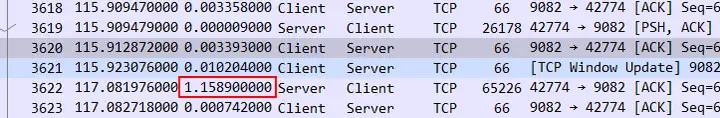
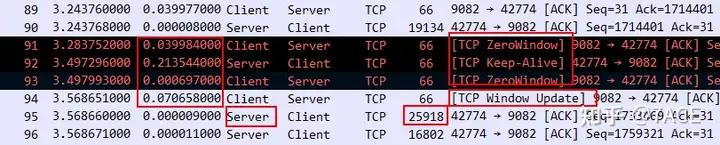
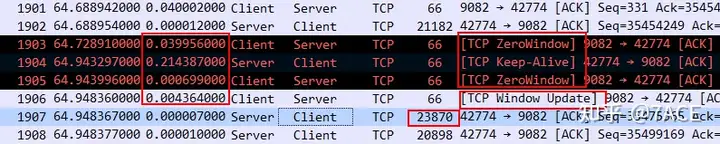
Because the server-side application waits too long to transmit data, the delay caused by the client ‘s zero window problem seems to be a small matter.
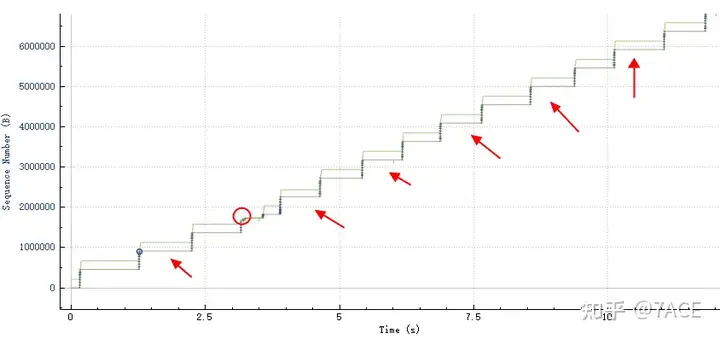
Tcptrace also shows the behavior of data transmission truthfully. After transmitting a piece of data, it lies horizontally for a while, continues to transmit, and continues to lie horizontally.
Summarize
The TCP Data Transmission Delay in the current business system is likely due to slow data transmission on the server side during peak hours or possibly an application or system performance issue. Further investigation and resolution are necessary from the R&D center application team.
Performance issues like slow transmission are not always network-related. With the right tools and knowledge, effective solutions can be implemented.