

Background
This problem case stems from a friend’s discussion on WeChat about Web Service Access Troubleshooting. While similar issues have occurred where web services were blocked, the detailed analysis of the data packets provides valuable insights into the problem, prompting me to document the troubleshooting process.
Problem Analysis
The end user reported that the mobile 4G could not open the website page. The troubleshooting captured the corresponding access data packets through the laptop WIFI hotspot.
For general packet capture methods, I personally recommend that you do not need to use capture filtering. You can extract the desired packets by display filtering on the complete packet file.
IP Session Filtering
Once you know the domain name of the website you are visiting, you can confirm the IP address through methods such as nslookup, and then filter out all data packets interacting between the source and destination through IP session filtering.
ip.addr eq 10.10.10.1 and ip.addr eq 192.168.0.1Then export the specific group and save only the filtered data packet file. You can find that there are multiple TCP session flows between the source and the destination. The results are as follows:
Some statistics of the data packet file are as follows. The number of data packets changes from 387 to 249 after IP session filtering.
$ capinfos -csdl 1226.pcap
File name:           1226.pcap
Packet size limit:   file hdr: 262144 bytes
Number of packets:   387
File size:           85 kB
Data size:           79 kB


$ capinfos -csdl 1226-01.pcapng
File name:           1226-01.pcapng
Packet size limit:   file hdr: (not set)
Number of packets:   249
File size:           54 kB
Data size:           46 kB
TCP stream session filtering
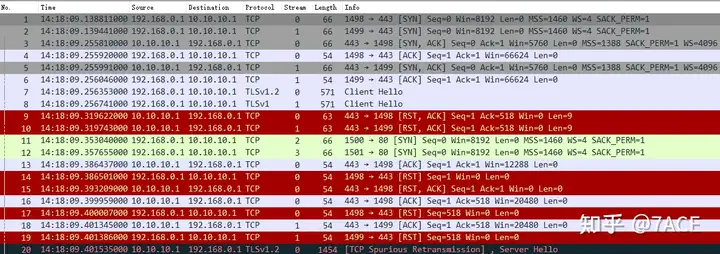
Due to different behaviors of client accessing the server, there are multiple TCP session flows triggered. Confirm the result by tracking the flow.
tcp.stream == <num>After a simple traversal of the contents of each flow, it is found that the RST anomalies are similar. One of the flows is selected for actual analysis. The data packet content is as follows.
tcp.stream == 4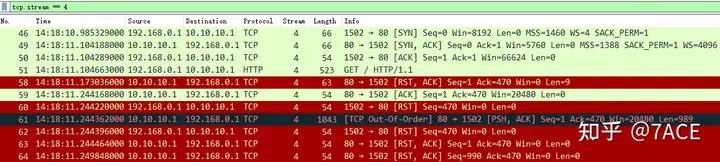
Actual analysis
The RST phenomenon is clearly seen from the TCP session flow. Normally, the RST inside the data center (without a security device area) usually comes from one of the two parties in the session. However, considering the existence of security devices, or in this case, access through the Internet (the data flow path network architecture is unknown), it is necessary to specifically determine where the RST comes from.
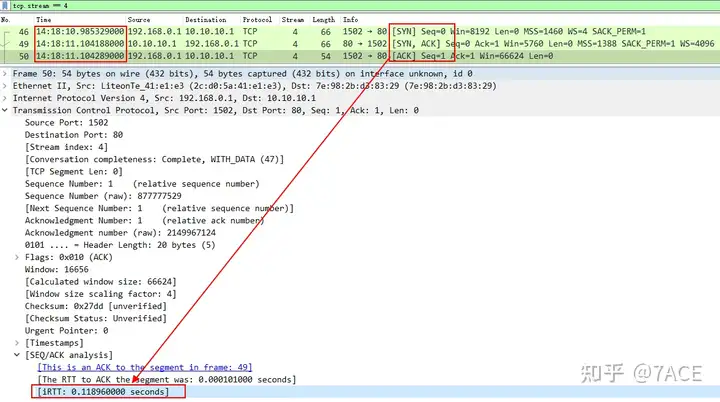
1. First, analyze the IRTT;
The IRTT information comes from the TCP three-way handshake and exists in the entire TCP stream as a reference. It can be roughly known that the round-trip time between the source and the destination is about 119 ms .
2. RST return time
Why can we use the RST return time as one of the criteria to determine where the RST comes from? If we think about it simply, if the RST comes from the server, then based on the IRTT value as a reference, it will basically be returned around 119 ms. However, if it is significantly smaller than the IRTT value, it is not necessarily returned by the server, but may be generated by an intermediate device (mostly security devices) .
Add Delta Time column, the expression meaning is frame.time_delta_displayed, see the previous article frame.time_delta and frame.time_delta_displayed for details .
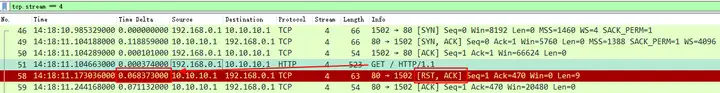
It can be clearly seen that RST is returned about 68 ms after the client GET request (packet 51) , which preliminarily indicates that it is not a real server return. How to further prove it? Use TTL .
3.TTL
As we all know, TTL can be used to determine the number of hops that an IP packet forwards in the network, so the TTL field is added as a column reference.
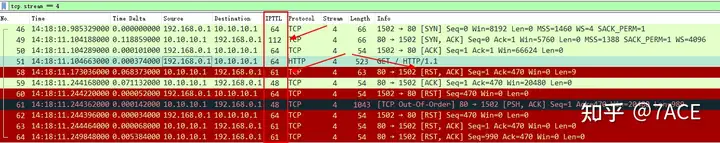
It can be seen that the TTL of the TCP three-way handshake SYN/ACK data packet is 112, but the TTL of the RST data packet is 61, which shows that they are not sent by the same device. Combined with the RST return time, it can be concluded that the Web service access is indeed blocked by the security device in the middle of the Internet .
In-depth analysis
Speaking of TTL, careful friends may notice the differences in the TTL values in the above figure, 64, 112, 61, 48. In particular, for the data packets from the server 10.10.10.1, the TTL values are 112, 61, and 48. What is the specific situation?
First, TTL. Due to the differences in operating systems and even protocols, the initial TTL values of different data packets are different. Some devices/operating systems are as follows:
| Device/OS | TTL | Remark |
|---|---|---|
| Linux | 64/255 | |
| Windows | 128 |
1.TTL 64
The TTL value 64 from the client, combined with the Length 54, indicates that the data packet file is captured on the local client.
2.TTL 61
The TTL value 61 carried in the RST data packet from the intermediate security device indicates that the security device is about 3 hops away from the client, which may be a security policy control implemented by an operator close to the local end.
3.TTL 112 and 48
The TTL value 112 carried by the server SYN/ACK in the TCP three-way handshake indicates that it is about 16 hops away from the client, judging from the initial value 128. The TTL value 48 carried by the server data packet indicates that it is about 16 hops away from the client, judging from the initial value 64.
So why does the same server generate two TTL values 112 and 48? My guess is that it is still caused by the security device, but this security device is on the server side (similar to a WAF device). During the TCP three-way handshake phase, the security device acts as a proxy for the TCP three-way handshake. After confirming that the TCP three-way handshake is officially completed, it forwards the normal business data packet to the real server, playing a security protection role (such as SYN Flood attack protection ). Therefore, TTL 112 is returned by the server-side security device, and TTL 48 is returned by the real server.
Summary of the problem
Combining the actual situation of the data packet, analyzing the meaning of each field in the data packet step by step will help to reasonably determine where the real fault is.