

Introduction to Load Balancer Timeout Issue
This case comes from the call center, which seems to receive the most technical support requests throughout the year, with inquiries coming in rapid succession. In this specific scenario, online agents experience a Load Balancer Timeout Issue when accessing images stored on the NAS of the IM server via HTTP. Timeouts occur intermittently, prompting a test where the HTTP interface of the image server is accessed in a loop from a stress-testing client. With a request interval of over 1 second, a timeout is recorded approximately once every 1000 requests, leading to suspicions of underlying internal network issues.
Overview of the Call Center Load Balancer Timeout Issue
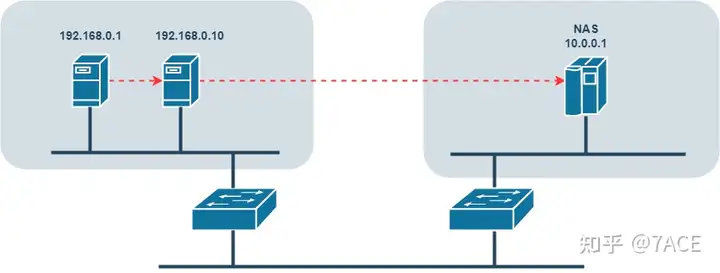
Network topology
Probably because of the many times of cooperation, the technical director provided the packet capture file on the image server side when raising the question, and roughly sorted out the access process as follows: the client 192.168.0.1 cyclically POSTs the image link of the server 192.168.0.10, and the server 192.168.0.10 then accesses the image resources stored on the NAS server 10.0.0.1.
Data flow: stress test client 192.168.0.1 <—> HTTP image server 192.168.0.10 <—> NAS server 10.0.0.1.
Packet filtering
The packet capture file on the image server 192.168.0.10 is large due to stress testing and some business operations, so packet filtering is routinely performed.
Considering that the data packet interaction objects are clear, it is sufficient to filter by IPv4 session, and then export specific groups and save only the data packet files that display the filtering.
(ip.addr eq 192.168.0.1 and ip.addr eq 192.168.0.10) or (ip.addr eq 192.168.0.10 and ip.addr eq 10.0.0.1)
Some statistical information of the data packet file is as follows. It can be seen that through reasonable filtering methods, the size and number of data packets are significantly reduced, which is conducive to subsequent loading and analysis by Wireshark.
$ capinfos -csdl 1230.cap
File name:           1230.cap
Packet size limit:   file hdr: 262144 bytes
Number of packets:   257 k
File size:           179 MB
Data size:           171 MB


$ capinfos -csdl 1230-01.pcap
File name:           1230-01.pcap
Packet size limit:   file hdr: 262144 bytes
Number of packets:   5250
File size:           11 MB
Data size:           11 MB
Session Statistics
By Statistics-> Conversationsviewing the data packet file information, the approximate transmission direction and size of the image file are as follows:
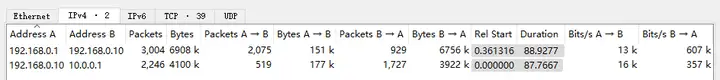
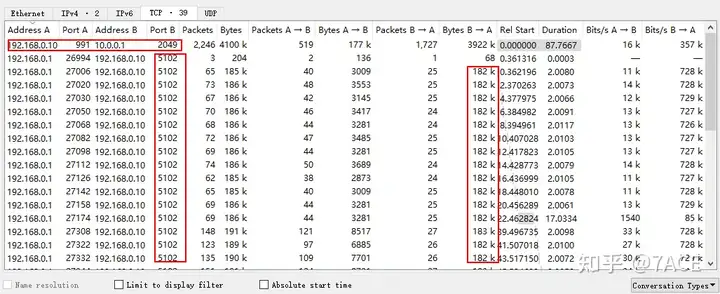
In the TCP session, due to the stress test program, the client 192.168.0.1 generates multiple TCP flows to interact with the server 192.168.0.10, while there is only one TCP session flow between 192.168.0.10 and NAS 10.0.0.1.
Detailed Problem Analysis of Load Balancer Timeout
192.168.0.1 <-> 192.168.0.10 Normal interaction
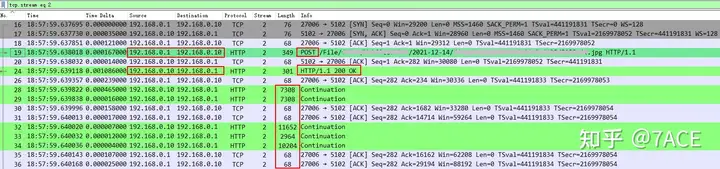
After briefly traversing the contents of each flow of 192.168.0.1 and 192.168.0.10, the behaviors and phenomena are basically the same. The interaction process under normal circumstances is as follows: 192.168.0.1 HTTP POST requests a JPG file, and 192.168.0.10 responds with 200 OK and then transmits data. After that, TCP waved four times normally, completing one interaction.
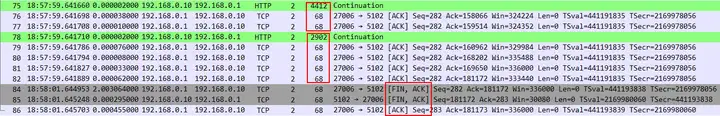
192.168.0.1 <-> 192.168.0.10 Abnormal interaction
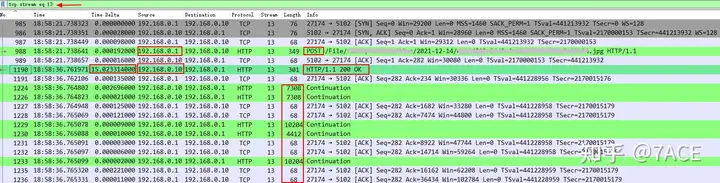
So how do we find out the request timeout problem? The so-called timeout must be caused by time. We also use the Delta Time column, the expression means frame.time_delta_displayed, and sort by size. It can be clearly seen that TCP Stream 13 has a large delay of 15s , which matches the response delay phenomenon reported in the business log, while other delays are just the normal waiting time when the FIN session closes the connection.
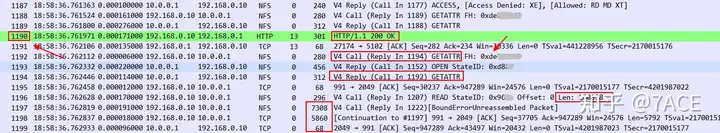
Expanding the data packets in TCP Stream 13, we can see that the server 192.168.0.10 only responded to the ACK at the network TCP level after the client POST request, and sent the HTTP 200 OK response No. 1190 data packet 15s later, which is much longer than the 1ms delay in the normal transmission interaction process.
If we only look at the interaction between 192.168.0.1 <-> 192.168.0.10, the 15s delay is obviously caused by the server-side response data being too long. However, in the previous section, we analyzed the complete interaction process of the data flow as follows: stress test client 192.168.0.1 <—> HTTP image server 192.168.0.10 <—> NAS server 10.0.0.1. So is the slow response of the server 192.168.0.10 a problem of itself or a problem caused by the interaction with 10.0.0.1?
192.168.0.1 <-> 192.168.0.10 <-> 10.0.0.1 Normal interaction
In the case of 192.168.0.1 <-> 192.168.0.10 <-> 10.0.0.1, 192.168.0.1 HTTP POST requests a JPG file, and 192.168.0.10 responds. Depending on whether there is a local image resource cache, there are two situations:
- If there is a local cache, 192.168.0.10 only queries the NAS server 10.0.0.1 for the image resource attributes (whether there are any changes, etc.). Because the stress test repeatedly requests the same resource, the resource actually does not change. Therefore, after a brief interaction between 192.168.0.10 <-> 10.0.0.1 is completed, 192.168.0.10 transmits the image to 192.168.0.1 again.
- If there is no local cache, 192.168.0.10 will request the image resource from the NAS server 10.0.0.1. After searching the directory, checking permissions, and performing read operations, 10.0.0.1 will transfer the image resource to 192.168.0.10. After completion, 192.168.0.10 will continue to transfer the image to 192.168.0.1.
Packet interaction with cache
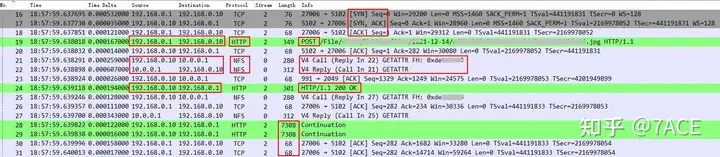
There will be an NFS protocol interaction process between 192.168.0.10 <-> 10.0.0.1, including Call GETATTR and Reply GETATTR under V4, between HTTP POST and Response 200 OK, and between HTTP Response 200 OK and Continuation to officially start transmitting image data.
Packet exchange without cache
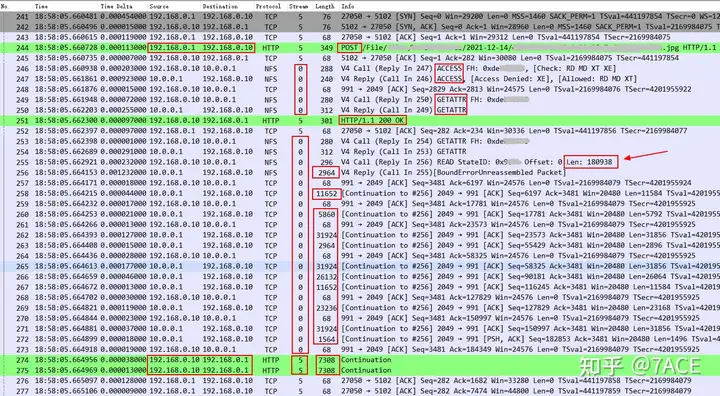
Compared with the case with cache, there is an additional ACCESS operation. At the same time, after HTTP POST and Response 200 OK, NFS 10.0.0.1 transmits image resources to 192.168.0.10 with a size of 180938. After both complete the transmission, the server 192.168.0.10 will continue to transmit the image to 192.168.0.1 until it is completed.
192.168.0.1 <-> 192.168.0.10 <-> 10.0.0.1 Abnormal interaction
TCP Stream 13 Then expand the complete data packets before and after the 15s delay mentioned in the above 192.168.0.1 <-> 192.168.0.10 abnormal interaction analysis to see what happened
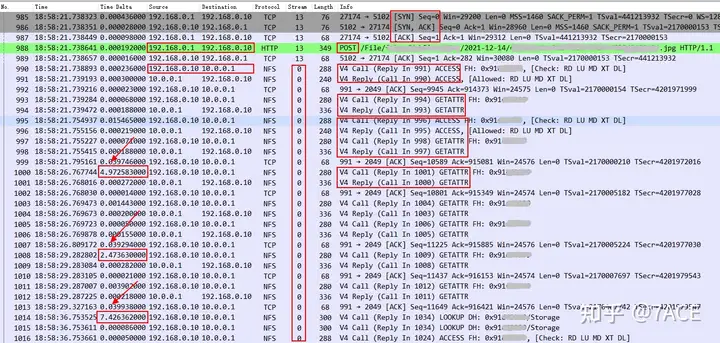
It can be clearly seen that after the client 192.168.0.1 sends the HTTP POST request, the number of interactive messages between the image server 192.168.0.10 and the NAS server 10.0.0.1 increases significantly. There are several problems:
- 192.168.0.10 frequently performs GETATTR operations, and the file handle changes from starting with 0xde to starting with 0x91 ;
- In the interaction between Call and Reply, the server 192.168.0.10 had a problem with too long Call request intervals, which were 4.97s, 2.47s, and 7.42s , respectively , adding up to about 14.86s , which just matched the 15s delay . This shows that the real problem occurred in the HTTP image server 192.168.0.10 itself .
Subsequent process
- 192.168.0.1 <-> 192.168.0.10 and so on, until the 0xde
ACCESS、GETATTR、LOOKUPfile is finally requested , and then it starts to return to normal; - After HTTP POST request No.988, HTTP 200 OK is not completed until No.1190.
Summary of the Call Center Load Balancer Timeout Issue
After further communication with the technical director of the call center, we learned that the server 192.168.0.10 was still in some production business during the stress test. It was suspected that after the server 192.168.0.10 received requests from different clients at the front end, when it requested NAS server resources later, it would generate requests for files in different mount file directories.
Considering the design of the NFS protocol itself (single stream), demand-response interaction, the server 192.168.0.10 generated some delays when initiating the next request, causing the response timeout. Therefore, the server system and NFS logs need to be further checked.
During the troubleshooting process, I took a quick look at NFSv4 RFC 7530 … Page 323. It gave me a headache. I still have many unclear points about the NFS protocol and the interaction process. I need to study it further when I have time.