

Introduction: The Avalanche Effect in Network Analysis
Avalanche effect, the technical “avalanche effect” theory, I simply understand that a call or dependency cannot provide a service, which may cause an avalanche effect, and finally make the entire service unusable. It may also be like a chain reaction or butterfly effect, which is a small factor change, and then continuously ferments to produce some unpredictable things, and finally produces unexpected results.
This article analyzes a real case of a service call problem from the perspective of network packet analysis.
Background: Identifying the Avalanche Effect in Service Failures
One day, the R&D center reported that the information business synchronization task failed many times. Because it was accessing the AWS cloud across data centers, it involved a dedicated line and suspected that it might be a network problem. It was reported to the network operation and maintenance. After communicating with relevant business colleagues, the following fault information was confirmed.
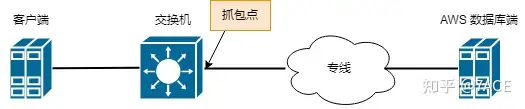
Problem Topology
Problem phenomenon
- The client netstat shows that the connection with the database is established, but there is no related connection on the database and the firewall.
- Synchronization tasks occasionally fail and stop after a few minutes. The application log shows that the task has not ended and there is no error log.
- Another feature of this synchronization task is that the bandwidth is relatively low, with only a few hundred items synchronized per second; while other synchronization tasks can reach tens of thousands, with a bandwidth of one or two megabytes.
Uncovering Network and Connection Issues
Client connection issues
The first step of the analysis was to confirm the connection problem. The client showed an Established connection, but there was no connection on the database and firewall. It sounded strange at first, so I asked each end to confirm again with a skeptical attitude, but the feedback was still the same. Then I asked the system manager to verify the packet capture on the client through tcpdump, but no relevant data packets were captured.
So what exactly is the problem?
- Assume that the application has a heartbeat keepalive mechanism or the system has the TCP keepalive option enabled
In this case, after a period of idle time when there is no end-to-end data transmission, the keep-alive mechanism will theoretically maintain the long connection. However, considering that there is no related connection between the database and the firewall, the session idle time may be relatively small on the firewall. First, the firewall deletes the session connection due to timeout, and then the database deletes the session connection due to timeout. However, due to application design issues, the client side does not time out, so the connection has always existed, but tcpdump does not capture it. This may be because the interval between the live check packets is long, while the capture time is short.
2. Assume that the application does not have a heartbeat keepalive mechanism or the system does not enable the TCP keepalive option
In this case, after a period of idle time when there is no data transmission between the end and the end, according to the firewall mechanism, the connection is definitely deleted after the idle session times out, and then the database side also deletes the connection due to session timeout. However, due to application design issues, the client side does not time out, so the connection remains, and tcpdump packet capture normally cannot capture related data packets.
Without being able to delve into the applications and systems, I feel that the second assumption is more like the real scenario .
After further searching related documents, I found out that the Established status timeout problem of the client is related to the following value: 432000 seconds, which is 5 days. This is consistent with the phenomenon that the application synchronization task started and stopped in the afternoon of the previous day, but the Established status connection can still be seen on the client netstat the next day.
[root@server ~]# cat /proc/sys/net/netfilter/nf_conntrack_tcp_timeout_established
432000
Traffic backtracking analysis
Considering that the client involves multiple applications and systems and cannot easily cooperate with packet capture, we synchronized the specific occurrence and stop time of the problem task with the relevant parties. On the network side, we used the Kelai traffic backtracking analysis equipment to retrieve the data packets on the AWS public cloud dedicated line when the problem occurred for offline analysis.
Normal connection
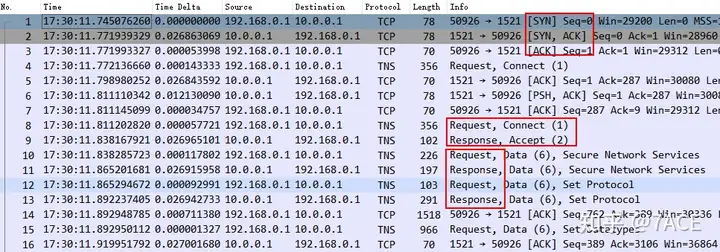
Under normal circumstances, the connection starts with a TCP three-way handshake, with an IRTT of about 27ms. The interaction is carried out through the Oracle TNS protocol, basically in pairs of Request and Response. During the transmission process, data packets of standard MTU 1500 size are sent and received normally.
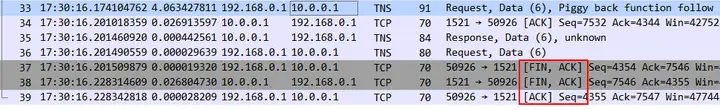
For synchronization tasks, after normal data transmission interaction is completed, the connection is ended with four TCP handshakes.
Abnormal connection
At the time of the service failure, the abnormal connection was discovered when tracing back the traffic. The analysis process is as follows
1. How to identify and find abnormal connections
First, when tracing back the traffic, we narrowed the data packet range based on the time in the application log. Second, the connection was incomplete. The transmission lasted for more than 8 minutes before it paused, and the transmission rate was only 588 kBps, which was consistent with the phenomenon reported by the application.
$ capinfos -ae test.pcapng
File name:           test.pcapng
Packet size limit:   inferred: 66 bytes - 1514 bytes (range)
First packet time:   2022-02-10 17:30:23.143816404
Last packet time:    2022-02-10 17:39:16.974296358


$ capinfos -y test.pcapng
File name:           test.pcapng
Packet size limit:   inferred: 66 bytes - 1514 bytes (range)
Data byte rate:      588 kBps
The incomplete connection mentioned above means that there are only normal TCP three-way handshake and data transmission phase packets, but no TCP four-way handshake packets to end the connection.
After the No.291010 packet, there was no packet interaction. The traffic tracing device was used to extend the time range and still no packets were seen. This again verified that the application did not have a heartbeat keepalive mechanism or the system did not enable the TCP keepalive option.
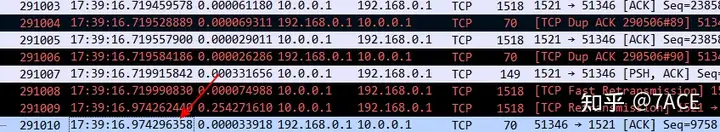
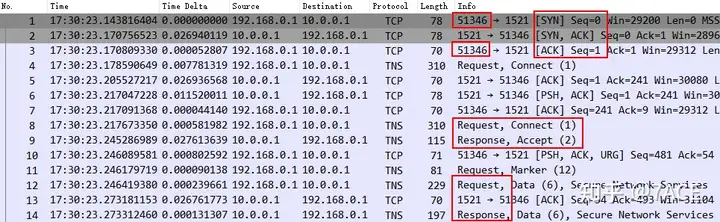
Another most important point is that since the application client still has connection information in netstat on the next day, we know through feedback that the source port is 51346, which means that the actual abnormal connection that matches the application problem has been found.
2. What kind of abnormality is there in the connection?
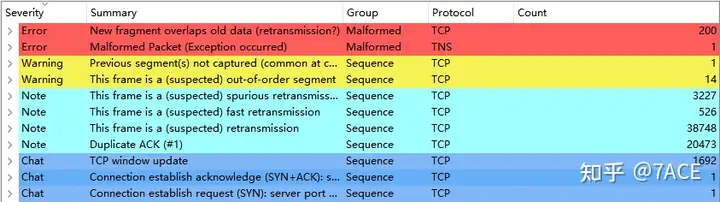
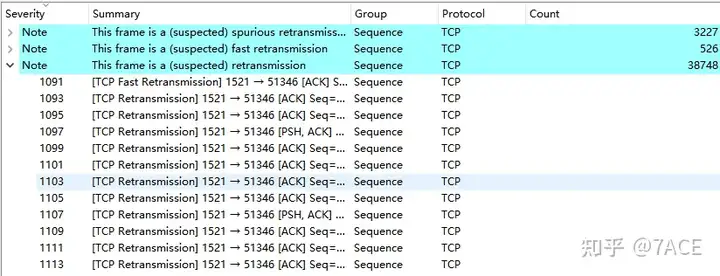
First, use Expert Information to quickly browse the abnormal information in the trace file. There is a large amount of suspected retransmission, fast retransmission, and retransmission information. The initial feeling is that there is a packet loss problem.
Expand the retransmission information, the direction basically occurs in the transmission direction from the database to the client.
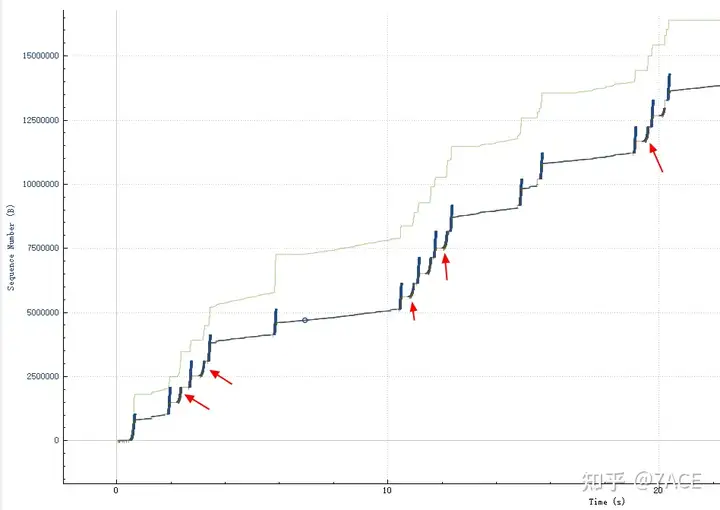
The Tcptrace graph shows a large number of retransmissions.
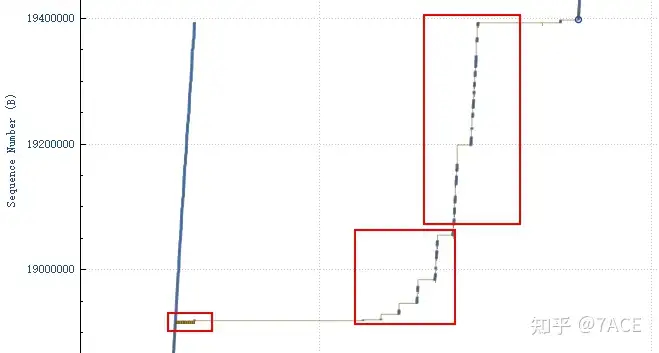
3. Why is the connection abnormal?
The most important step is to locate the cause of the fault. We used the traffic backtracking analysis equipment of Colai to sort out the dedicated line bandwidth usage. It was found that the dedicated line bandwidth was not fully used during the fault time range, and there was no sudden traffic spike, indicating that there was no problem with the dedicated line bandwidth.
Expand the location of abnormal information in the trace file, and you will first find that there are many DUP ACK phenomena.
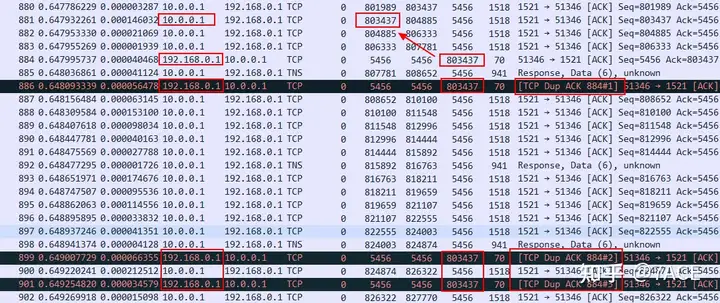
No.886, No.899, No.901… ACK packets keep ACK num 803437. At the dedicated line capture point, you can see the packet No.881 sent from the database to the client Seq num 803437. This means that the packet No.881 is lost inside the data center and the client does not receive it. It is even possible that some packets after No.881 are not received.
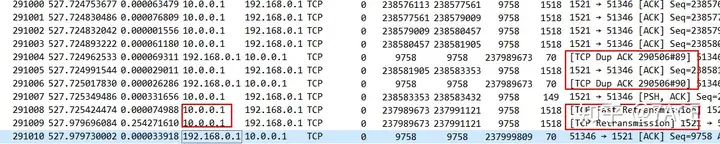
Continue down to the retransmission position
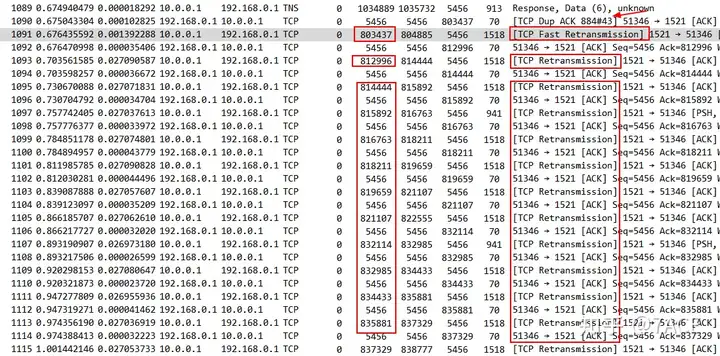
After TCP Dup ACK 884#43 occurred 43 times, fast retransmission on the database side was triggered. No.1091 retransmitted the data packet of Seq 803437, followed by a series of retransmitted data packets. From the perspective of Seq num, they have all been seen once in the trace file, which may indicate that multiple segment packet losses have occurred in the data center.
What? The low-bandwidth dedicated line did not lose packets, but packets were lost inside the data center? ? ? The network quickly checked the path taken by the client inside the data center to access the database, and found that the network line was not full. It was a false alarm. Then the problem of packet loss inside the data center could only be pointed to the client. After further detailed communication with the system manager, the feedback was that iptables speed limit was set on the client … The reason was that the dedicated line bandwidth was once fully utilized during application task synchronization, so speed limit was set on the client. OK, information was not synchronized.
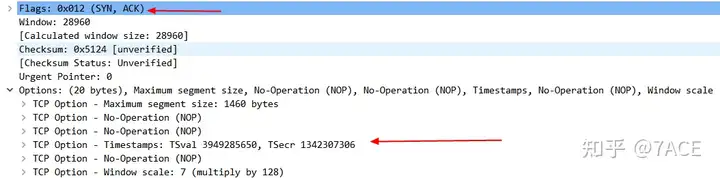
There is actually a critical problem in the above figure. The retransmitted data packets after No.1091 basically transmit all the data packets after the lost packet of Seq 803437. What does this mean? There is no SACK. Looking back at the TCP three-way handshake, it is true that SACK is not supported on the database side. This problem leads to low transmission efficiency and retransmission of many segments that should not be retransmitted.

The exceptions formed a pattern, with large amounts of packets being lost – retransmitted – recovered – packet lost – retransmitted. Finally, the database side became stuck and no data was retransmitted, so the interaction stopped.
Resolving the Network Avalanche Effect
In summary, the actual cause of the problem is that the client has set iptables speed limit, which causes packet loss after the data transmission rate reaches a certain rate on the database side. In addition, because the SACK option is not enabled on the database side, too many data packets are retransmitted, which further reduces the transmission efficiency. After repeated repetitions, the database side falls into silence, which is reflected in the business as synchronization tasks stop. After that, because the liveness detection mechanism is not enabled on the application and system, the firewall deletes the connection when the idle session times out, and then the database deletes the connection when the idle session times out. Finally, the application client has no connection exit mechanism, so the connection is always established.
Some points that can be optimized:
- The network dedicated line bandwidth is upgraded, and the client removes the iptables speed limit;
- Enable the TCP SACK option on the database side;
- Enable the heartbeat detection mechanism or TCP keepalive;
- Optimize application code and exit upon timeout.
Lessons from the Avalanche Effect in Network Analysis
The case study illustrates how small factors can escalate into significant service disruptions, embodying the concept of the avalanche effect. It underscores the importance of holistic network monitoring, timely updates to infrastructure settings, and proactive measures to prevent minor issues from snowballing into critical failures.