

Understanding TCP Out-of-Order Issues in Quark Browser
This article addresses the issue of TCP out-of-order packets causing slow video playback on Quark Browser. Through a detailed analysis of the network trace file, we uncover unusual patterns, such as packet disorder, retransmissions, and inconsistencies in data frame lengths. Understanding these TCP out-of-order problems is crucial to identifying the root cause and optimizing video streaming performance.
How TCP Out-of-Order Affects Video Playback Performance
The information in the tracking file is relatively simple. It comes from home users who report that the video playback on Quark Browser is slow. With the support of on-site technicians, the data packets when the problem occurred were also captured.
Quark browse the trace file
Generally, the number of packets in a trace file can be as many as one or as many as one million. If there are so many packets, it is indeed a technical job to determine whether Wireshark can load and run smoothly, how to display and filter after loading, and how to locate and analyze to get the information you want.
Wireshark provides some good information display in fault analysis. As shown below, at the far right of the packet list view, packets marked with different colors are displayed based on the coloring rules. For example, the default black background + red text describes tcp.analysis.flagsBad TCP packets with , such as common disorder and retransmission.
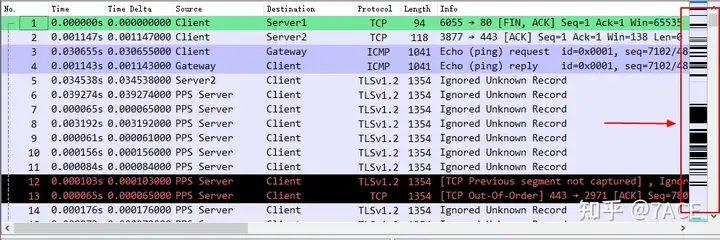
The entire trace file in the figure above shows many problems from the coloring rules. You can also see the icon in the lower left corner of the Wireshark status bar, which represents the summary information of , which can also be entered from Analysis->Expert Information.

Click the red icon to view expert information, as follows
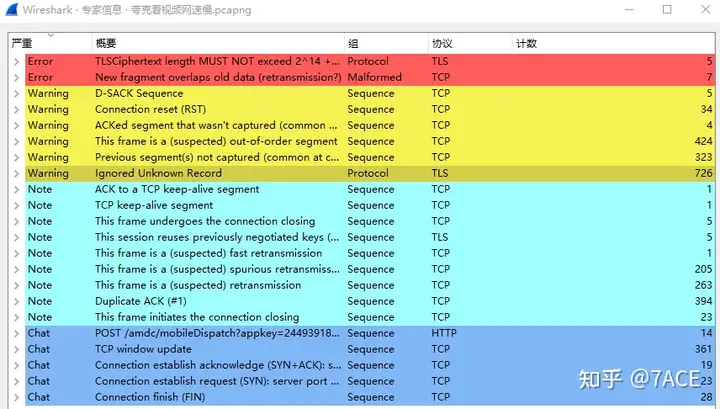
Trace file interface information
$ capinfos -I Quark.pcapng
File name:           Quark.pcapng
Packet size limit:   inferred: 54 bytes - 1354 bytes (range)
Number of interfaces in file: 1
Interface #0 info:
                     Name = \Device\NPF_{F60B5ED9-A99A-4C66-9F97-533629F6E07E}
                     Description = Local connection
                     Encapsulation = Ethernet (1 - ether)
                     Capture length = 262144
                     Time precision = microseconds (6)
                     Time ticks per second = 1000000
                     Time resolution = 0x06
                     Operating system = 64-bit Windows 7 Service Pack 1, build 7601
                     Number of stat entries = 1
                     Number of packets = 4940
Positioning analysis
Through the provided video server IP, the filtered data packets are displayed as follows
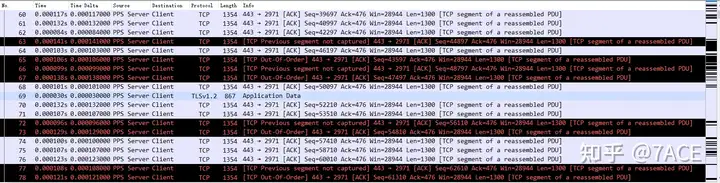
Indeed, in the interaction between the Client and the PPS Server, there are a lot of disordered, (suspected) retransmissions, and fragmented information that is not captured. By observing the Identification (ip.id) field, we can first find that in the PPS Server -> Client direction, there are a lot of disordered, and possible retransmissions caused by packet loss.
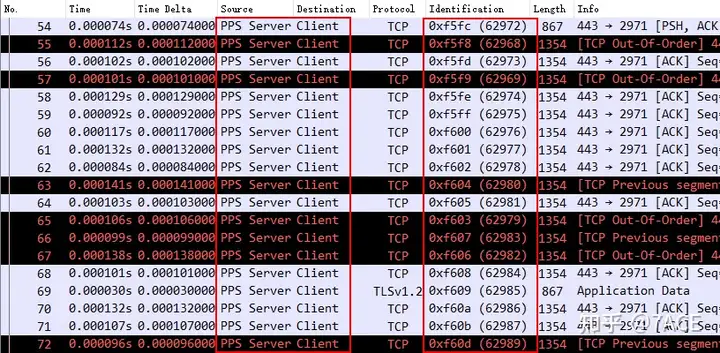
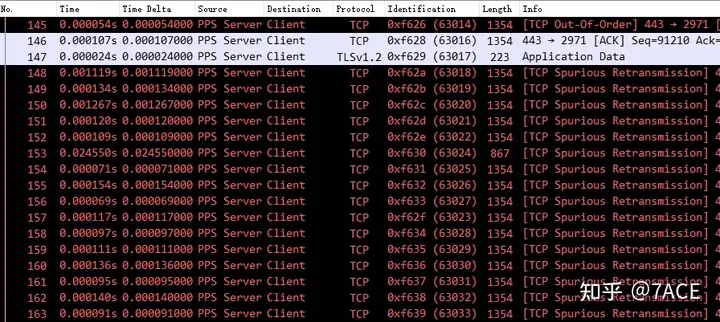
Because the capture point of the trace file is at the client, the general analysis so far may be considered that the server has packet loss or serious disorder in the transmission path, which causes some retransmission or fast retransmission problems, resulting in slow and stuck browsing of the video.
But as mentioned at the beginning of this article, this is a very special case. Is this the real situation?
In-depth analysis
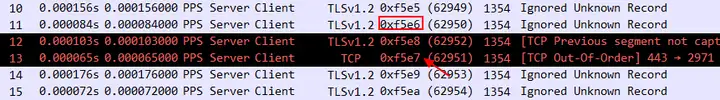
Looking further into the trace file, there is also a lot of disorder in the Client -> PPS Server direction, that is, the local sending direction.
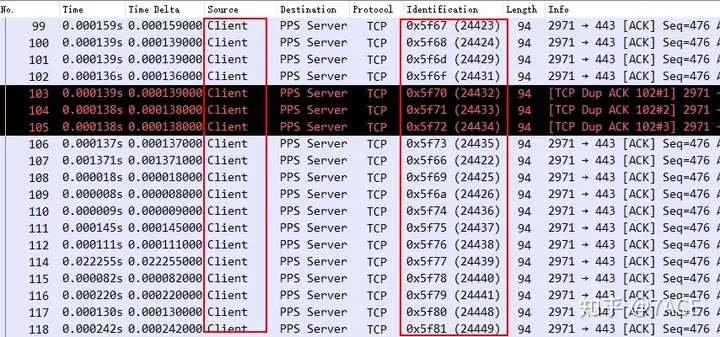
This is a very strange phenomenon, because the capture point of the trace file is at the client, which means that the local order is out of order? Considering the working principle of Wireshark, it captures data packets before entering the network card, which means that there may be problems with the client system kernel protocol stack or winpcap/npcap.
Another very strange phenomenon is the length of the data frame.
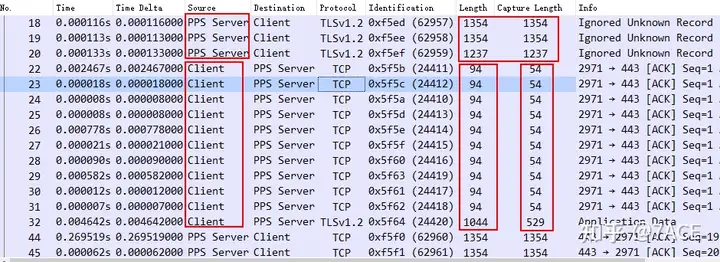
It is also a client problem, the data frame length is inconsistent with the capture length . The normal data frame length of ACK should also be 54 bytes, but it will be displayed as 94 bytes. It is not just ACK, other data packets with data payload, the data frame length should be 529 bytes, but it will be displayed as 1044 bytes.
The data frame length here is inconsistent with the capture length. This is not a problem with the snaplen capture settings, because different data packets have different capture lengths.
But for the data packets sent by the PPS Server, everything is normal, and the data frame length is consistent with the capture length, 1354 or 1237 bytes.
Summary of the problem
Taking into account the abnormal phenomena on the client and the comparison of the data packets at both ends, the local disorder and the abnormal data frame length are most likely caused by problems in the client system kernel protocol stack. This is a rare case.
The party that directly handled the non-fault situation reported a day or two later that the problem had disappeared, perhaps because the user had restarted the computer and it had recovered.