

Preface
Observation is a crucial source of knowledge in network packet analysis, emphasizing the need for careful attention. Through meticulous observation, we uncover insights that can enhance our understanding of networking issues, including cases of slow web server.
Still referring to the problem of tidying up packet trace files mentioned earlier , this time we uncovered a case of a slow web server.
Problem Information
The basic information of the packet trace file is as follows:
$ capinfos SlowWeb.pcapng
File name:           SlowWeb.pcapng
File type:           Wireshark/... - pcapng
File encapsulation:  Ethernet
File timestamp precision:  microseconds (6)
Packet size limit:   file hdr: (not set)
Number of packets:   26
File size:           9220 bytes
Data size:           7795 bytes
Capture duration:    3.258294 seconds
First packet time:   2018-03-10 05:45:17.155473
Last packet time:    2018-03-10 05:45:20.413767
Data byte rate:      2392 bytes/s
Data bit rate:       19 kbps
Average packet size: 299.81 bytes
Average packet rate: 7 packets/s
Strict time order:   True
Capture application: Sanitized by TraceWrangler v0.6.8 build 949
Capture comment:     Sanitized by TraceWrangler v0.6.8 build 949
Number of interfaces in file: 1
Interface #0 info:   ...

$
The trace files were processed through an anonymization tool and some information was removed.
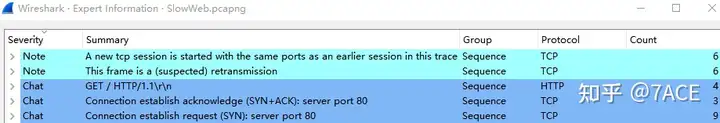
The packet trace file should be captured directly by Wireshark, with 26 packets and an average rate of 19 kbps. Some problems shown by the expert information include suspected retransmissions and TCP sessions using the same port.
Problem Analysis
The complete information of the actual data packet is as follows:
SYN Retransmission
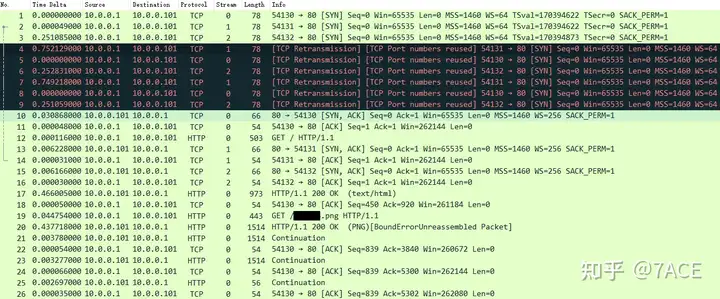
The first thing you can see is that the client SYN keeps retransmitting, trying to initiate HTTP 80 requests to the Web server with source ports 54130, 54131, and 54132, but the Web server does not respond. This may be because there is no route to the server, the firewall is filtering, or the server is overloaded and unresponsive, etc. Because the TCP SYN retransmission uses the same TCP source port, Wireshark will prompt it TCP Port numbers reused.
The TCP SYN retransmission pattern here is as follows. The retransmission interval is 1s. TCP Streams 0, 1, and 2 are all consistent. What does this mean? We can infer that the system that captured the data packets is macOS.

Generally speaking, the SYN timeout retransmission time and retransmission times of different versions of operating systems will be different, as briefly described below:
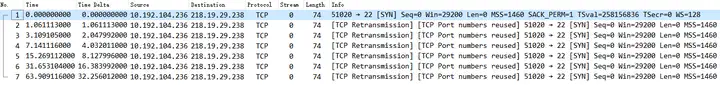
- Linux
The timeout retransmission time is 1 second and 3 seconds. The current mainstream is 1 second. The number of retransmissions is generally 5 or 6 times, and the waiting time for each timeout is twice that of the previous one. The rule is that the first timeout retransmission is after 1 second, the second timeout retransmission is after 2 seconds, the third timeout retransmission is after 4 seconds, the fourth timeout retransmission is after 8 seconds, the fifth timeout retransmission is after 16 seconds, and the sixth timeout retransmission is after 32 seconds.
2. Windows
The timeout retransmission time is generally 3 seconds, and the number of retransmissions is 2. Similarly, the timeout waiting time is twice that of the previous time.

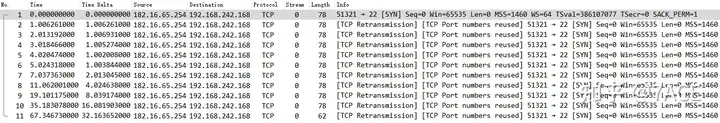
3. macOS
macOS rarely pays attention to it, but occasionally tests the following phenomenon: The timeout retransmission time should be 1 second, and the number of retransmissions is 10. The first 5 times are separated by 1 second each time, and the next 5 times the timeout waiting time is twice that of the previous time, 2 4 8 16 32 seconds.
SlowWeb
But actually, starting from No.10, it is found that the web server begins to respond to SYN/ACK. The following still takes TCP Stream 0 as an example.
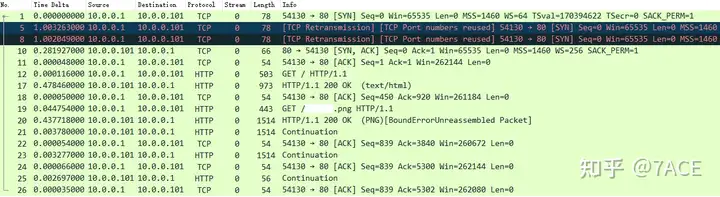
The client SYN was retransmitted twice at an interval of 1 second. After No. 8 SYN reached the Web server, the server responded with No. 10 SYN/ACK, and the client responded with ACK, thus completing the TCP three-way handshake. However, judging from the IP addresses of the client and Web server, they belong to the same VLAN, but the IRTT between them is as high as 281ms. Combined with the previous phenomenon of continuous SYN retransmission, it can be basically determined that it is a performance problem of the Web server, and the overload caused the slow response.
In the subsequent HTTP interaction process, the web server still processed slowly. Client No.12 made a GET request, and it took 478ms to receive the server’s HTTP response 200 OK (here even the Delayed ACK at the TCP protocol level was not sent, which is the theoretical 40ms or 200ms interval). Client No.19 made a GET request for a png picture, and it also took 437ms to receive the server’s HTTP response 200 OK (PNG).
The [BoundErrorUnreassembled Packet] in No.20 is because the Allow subdissector to reassemble TCP streams option of the TCP protocol is turned off during HTTP analysis, resulting in failure to reassemble TCP segments normally.
Summary of the problem
Although this case is simple, there are still some knowledge points in it after analysis, such as the SYN retransmission interval and number (to determine different operating systems and RFC implementations), expert tips (the meaning of TCP Port numbers reused and BoundErrorUnreassembled Packet) and Delayed ACK, etc.